ADS-B data observation and processing in ASEAN


At present ADS-B is considered as an additional standard for tracking aircraft. There need to check quality of ADS-B system for example precision of positioning and speed. The amount of error tolerance of each flight range can very different. That why there a need to collect the quality of ADS-B data in each area. Therefore, we using software defined radio (SDR) to receive ADS-B and Mode-S messages and compute it using the software program that we created to use in Raspberry Pi. The program will compute the ADS-B and Mode-S messages.

ADS-B Data

Displays information of ADS-B messages that are received from aircraft in a single message.This message show multiple variables such as speed, altitude, NACp, NIC SIL, etc.

search

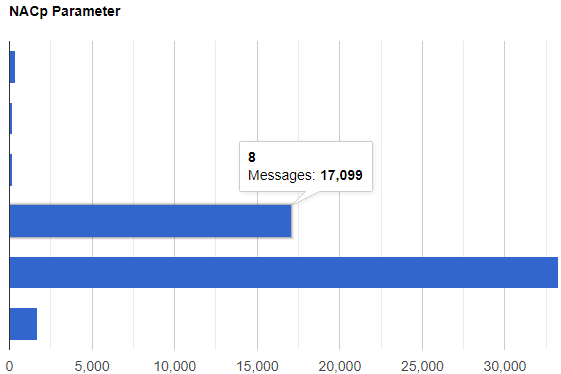
Quality Measurement (Indicator)

The distribution graph of quality indicator values obtained from the ADS-B device.

see

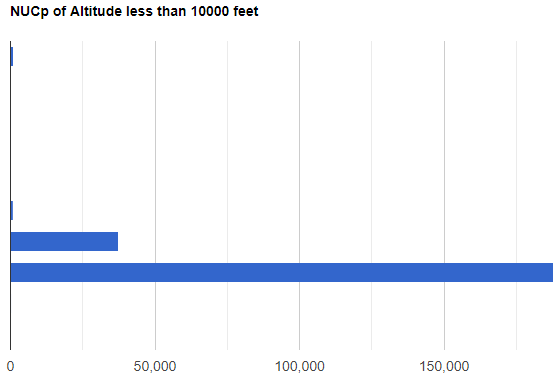
Quality Measurement (Altitude)

NUCp distribution graph in each altitude range to know how reliable it is in the altitude range.

see

Tracking Map

Show the receiving flight signal on the map.

search

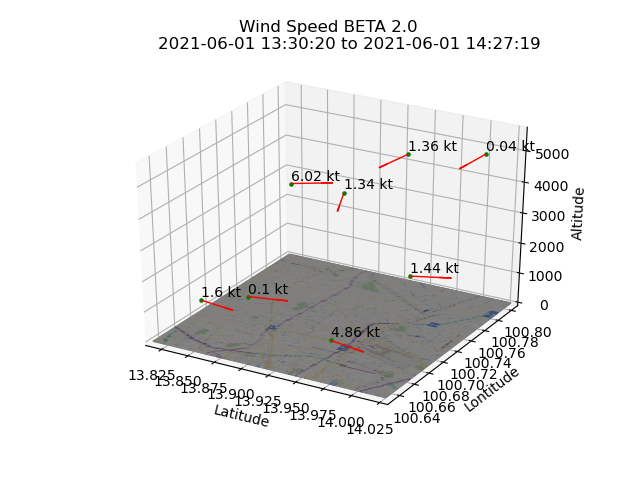
Wind Map (prototype)

Wind map using collected ADS-B and Mode-S data to calculate wind speed and direction.

see

Quality Indicator

Quality Indicators from ADS-B

Parameters reference

  • Please Click here

  • Chat with our chatbot
  • chatbot